When people try to make an org chart in Word, nine times out of ten they immediately open the Shapes menu, drop fifteen individual rectangles onto the page, and try to wire them together with loose elbow connectors.
Twenty minutes later, a single VP changes teams or one new hire joins the engineering department—and pushing one box half an inch sideways turns every connector line on the page into tangled spaghetti.
Microsoft Word actually ships with a purpose-built hierarchy engine inside SmartArt that recalculates box spacing, font scaling, and orthogonal reporting lines automatically. The only reason most users give up on it is that Word defaults to a cramped Portrait layout where six direct reports spill right off the page.
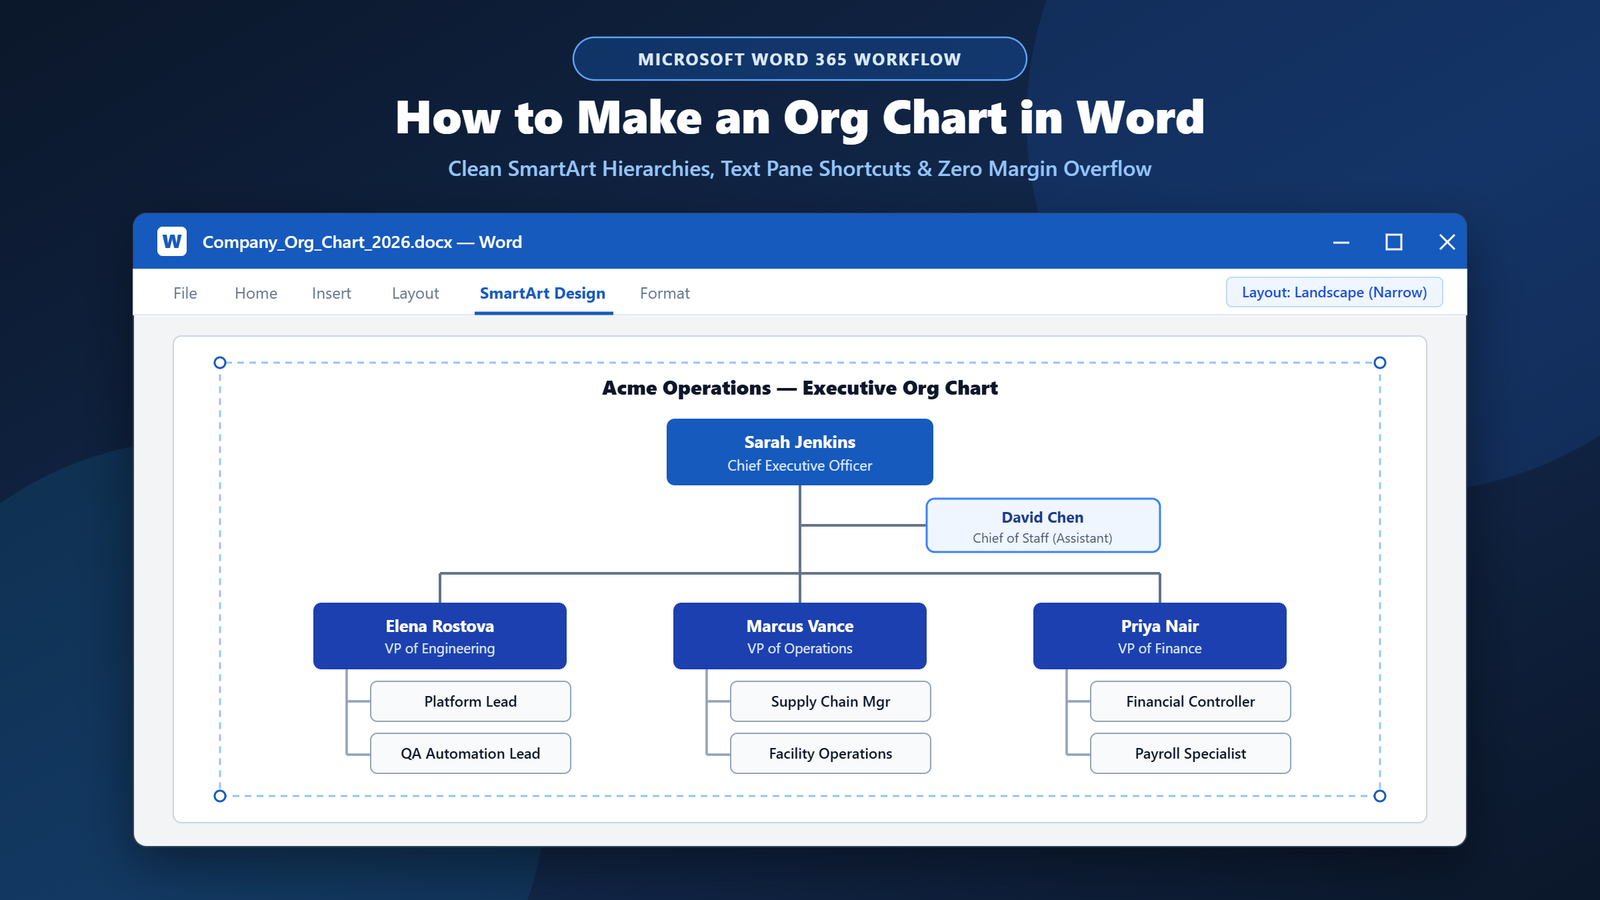
Here is the exact workflow I use to make an org chart in Word that looks executive-ready, edits in seconds via keyboard shortcuts, and stays locked cleanly inside your page margins.
SmartArt vs. Manual Shapes vs. Visio: Which Method Should You Use?
Before inserting your first box, pick the right tool for your team size so you do not have to rebuild the chart halfway through:
| Method in Word | Best Headcount | Auto-Aligns Connectors? | Real-World Verdict |
|---|---|---|---|
| SmartArt Hierarchy (Recommended) | 3 – 45 roles | Yes (Automatic) | Fastest way to make an org chart in Word; edits like a bullet list. |
| Manual Shapes + Drawing Canvas | 3 – 10 roles | Partial (Anchor points) | Good for dotted-line matrix reporting, tedious when adding roles. |
| Embedded Excel / Visio Diagram | 50+ roles | Yes (Data-linked) | Best when generating huge charts directly from an HR CSV directory. |
Step 1: Insert SmartArt to Make an Org Chart in Word
There are several hierarchy diagrams inside Word, and picking the wrong one costs you critical features later—specifically, the Assistant reporting branch (such as a Chief of Staff or Executive Assistant sitting slightly off the main spine between the CEO and VPs).
- Place your cursor on a blank line where the chart belongs.
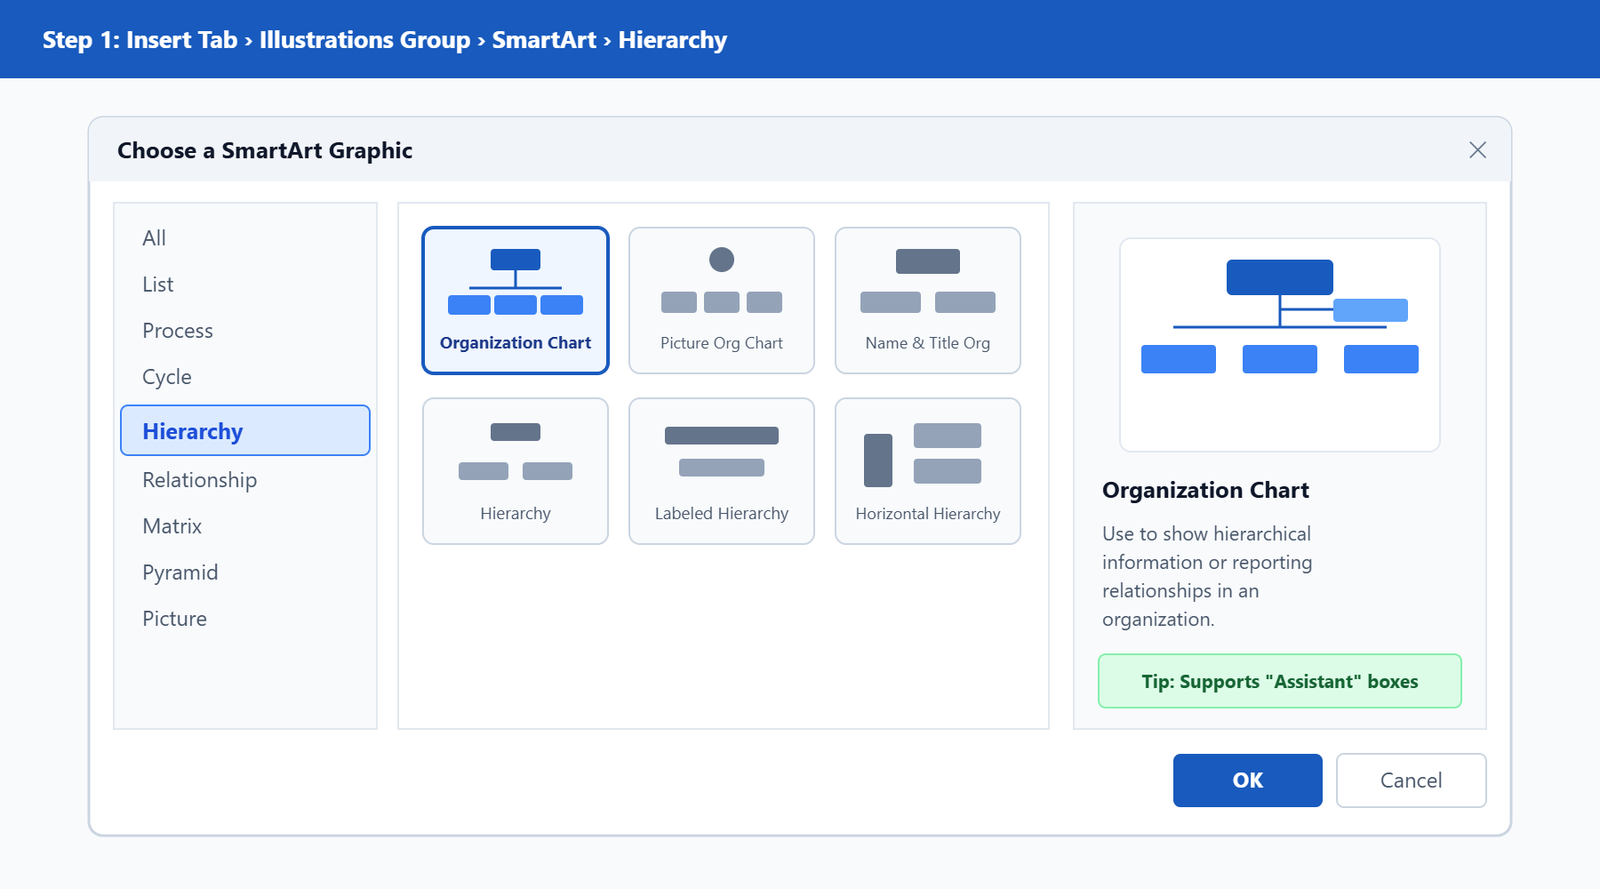
- On the top ribbon, open the Insert tab and click SmartArt inside the Illustrations group.
- In the left sidebar of the Choose a SmartArt Graphic dialog, select Hierarchy.
- Select the very first layout: Organization Chart (do not pick generic Hierarchy unless you have zero assistant roles). Want headshots inside each node? Pick Picture Organization Chart or Circle Picture Hierarchy instead.
- Click OK to drop the starter diagram onto your canvas.
Step 2: Build Reporting Lines Fast Using the Text Pane (Not Mouse Clicks)
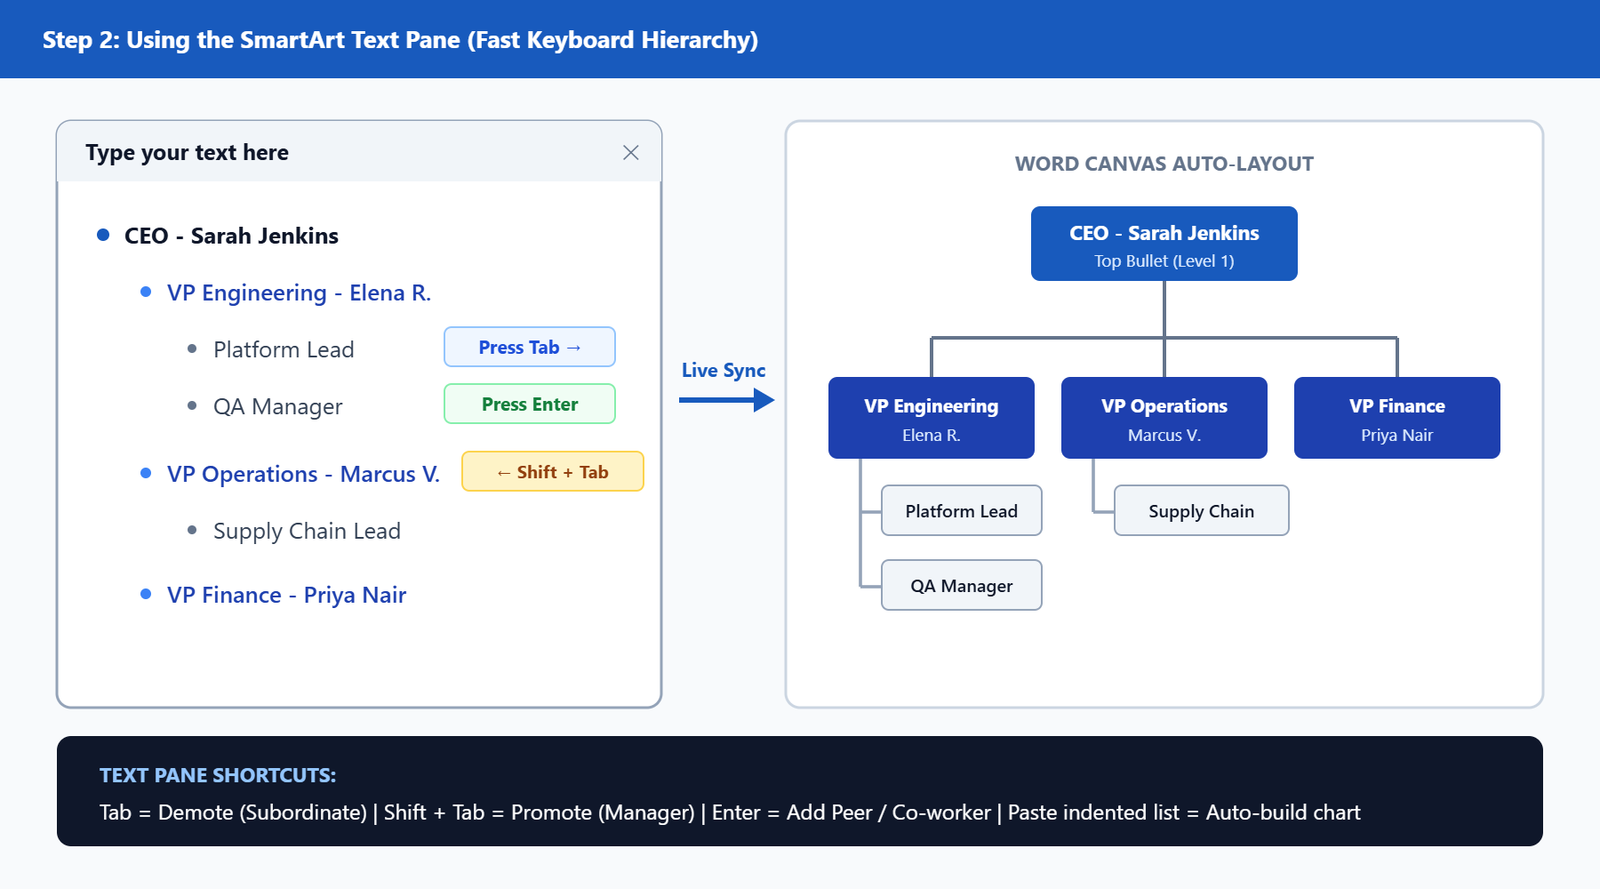
Clicking inside tiny SmartArt shapes to type names and job titles is painfully slow. The fastest way to make an org chart in Word is to leave your hands on the keyboard inside the Text Pane.
If the Text Pane does not open automatically on the left side of your diagram, click the small arrow tab on the left edge of the SmartArt border—or open SmartArt Design > Create Graphic > Text Pane.
Treat the Text Pane just like a standard multilevel bullet list:
- Type a Peer / Co-worker: Press Enter at the end of a line to spawn another box at the exact same reporting level.
- Demote Under a Manager (Make Subordinate): Press Tab at the start of a line. Word immediately moves that box underneath the person directly above it.
- Promote Up a Level: Press Shift + Tab to move a role back up one management tier.
- Add a Job Title Inside the Same Box: Press Shift + Enter (soft line break) instead of plain Enter. Plain Enter creates a brand-new employee box;
Shift + Enterdrops to a second line inside the same shape for the person’s title. - Delete Empty Boxes Cleanly: Click inside an unused bullet line in the Text Pane and press Backspace twice rather than trying to click borders on the canvas.
Pro-Tip: Paste an Entire Indented Roster from Notepad or Excel
Already have your company directory sitting in a text list or spreadsheet? You don’t need to type employees one by one. Build a quick tab-indented outline in Notepad (1 tab per tier), select everything, copy it, click inside the SmartArt Text Pane, press Ctrl + A, and paste (Ctrl + V). Word builds every reporting tier instantly. (If your exported HR roster came out in ALL CAPS, normalize names first in one click with our free Case Converter tool).
Step 3: Add Assistant & Dotted-Line Roles When You Make an Org Chart in Word
Sometimes an employee does not sit cleanly in a strict top-down tree—for instance, a Chief of Staff reporting to the CEO, or an advisor sitting above regional leads. Rather than breaking SmartArt to draw manual shapes, use the Add Shape dropdown:
- Click the manager box (e.g., CEO) directly on the chart.
- Go to SmartArt Design > Create Graphic and click the small arrow next to Add Shape.
- Choose the exact relationship you need:
- Add Shape After / Before: Adds a peer at the same rank.
- Add Shape Above: Inserts a new supervisor directly above the selected role while keeping subordinates intact.
- Add Shape Below: Adds a direct report underneath the selected manager.
- Add Assistant: Spawns a dedicated side-branch box connected via an elbow stem—the hallmark of clean executive org charts.
Need to show a secondary dotted-line reporting relationship? Click a connector line directly, open the Format tab > Shape Outline > Dashes, and switch that line to dashed without breaking SmartArt alignment.
Step 4: Fix Cramped Boxes with Hanging Layouts (The Secret to Clean Charts)
Here is the exact point where most people think Word SmartArt is broken: you add seven or eight direct reports under a single VP, and Word shrinks every single box into tiny, unreadable 6-point text across one giant horizontal row.
You can fix this in three clicks without resizing a single shape manually:
- Click the Manager box directly above the crowded horizontal row (not the subordinates themselves).
- In the top ribbon, go to SmartArt Design > Create Graphic > Layout.
- Switch from Standard to one of the three vertical-stacking modes:
- Both: Splits subordinates cleanly into two balanced columns hanging down a central vertical spine.
- Left Hanging: Stacks all direct reports neatly down the right side of a left vertical spine—ideal for wide department trees.
- Right Hanging: Stacks all boxes down the left side of a right vertical spine.
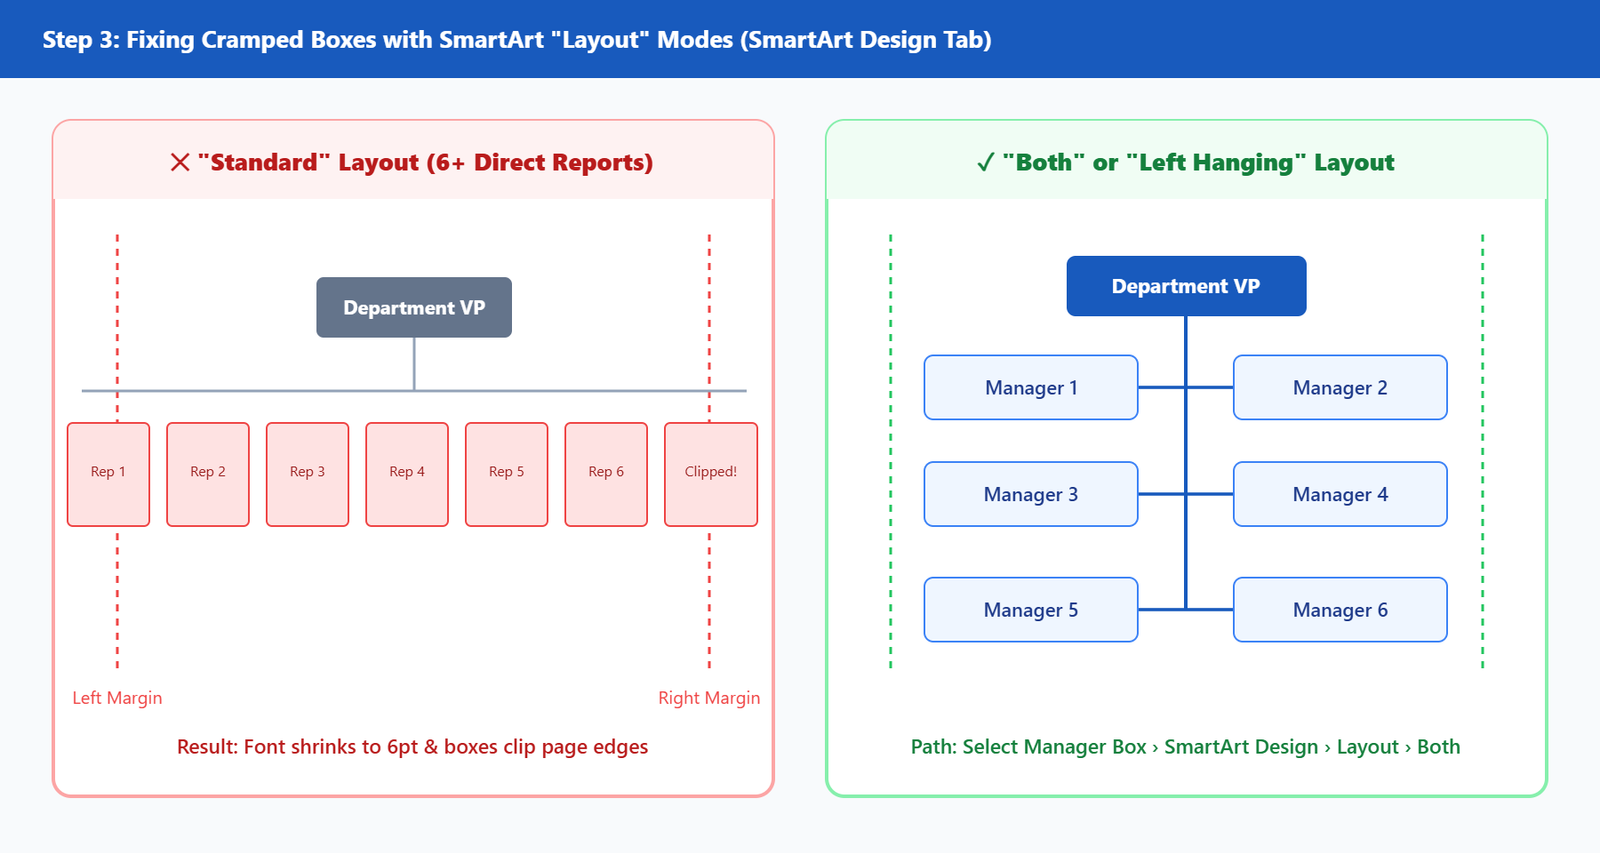
Crucial detail: You can mix layouts inside the same chart. Keep your top C-suite tier on Standard (horizontal row), and switch individual VP branches below them to Both or Left Hanging so every name stays crisp at 9–11pt font.
Step 5: Stop Wide Org Charts from Breaking Document Margins
When you make an org chart in Word for a multi-department team, horizontal space matters just as much as hanging layouts. On a standard 8.5" × 11" Portrait page with 1-inch margins, you only get 6.5 inches of usable width. By isolating only the org chart page in Landscape with Narrow margins, you instantly jump to 10.0 inches of horizontal room—more than a 53% width boost—without rotating the rest of your report.
- Click right before your chart heading and go to Layout > Breaks > Section Breaks > Next Page.
- Click on the chart page itself, then select Layout > Orientation > Landscape.
- On that same page, click Layout > Margins > Narrow (0.5" all around).
- Click right after the chart and insert another Layout > Breaks > Section Breaks > Next Page, then switch Orientation back to Portrait for the remainder of your document.
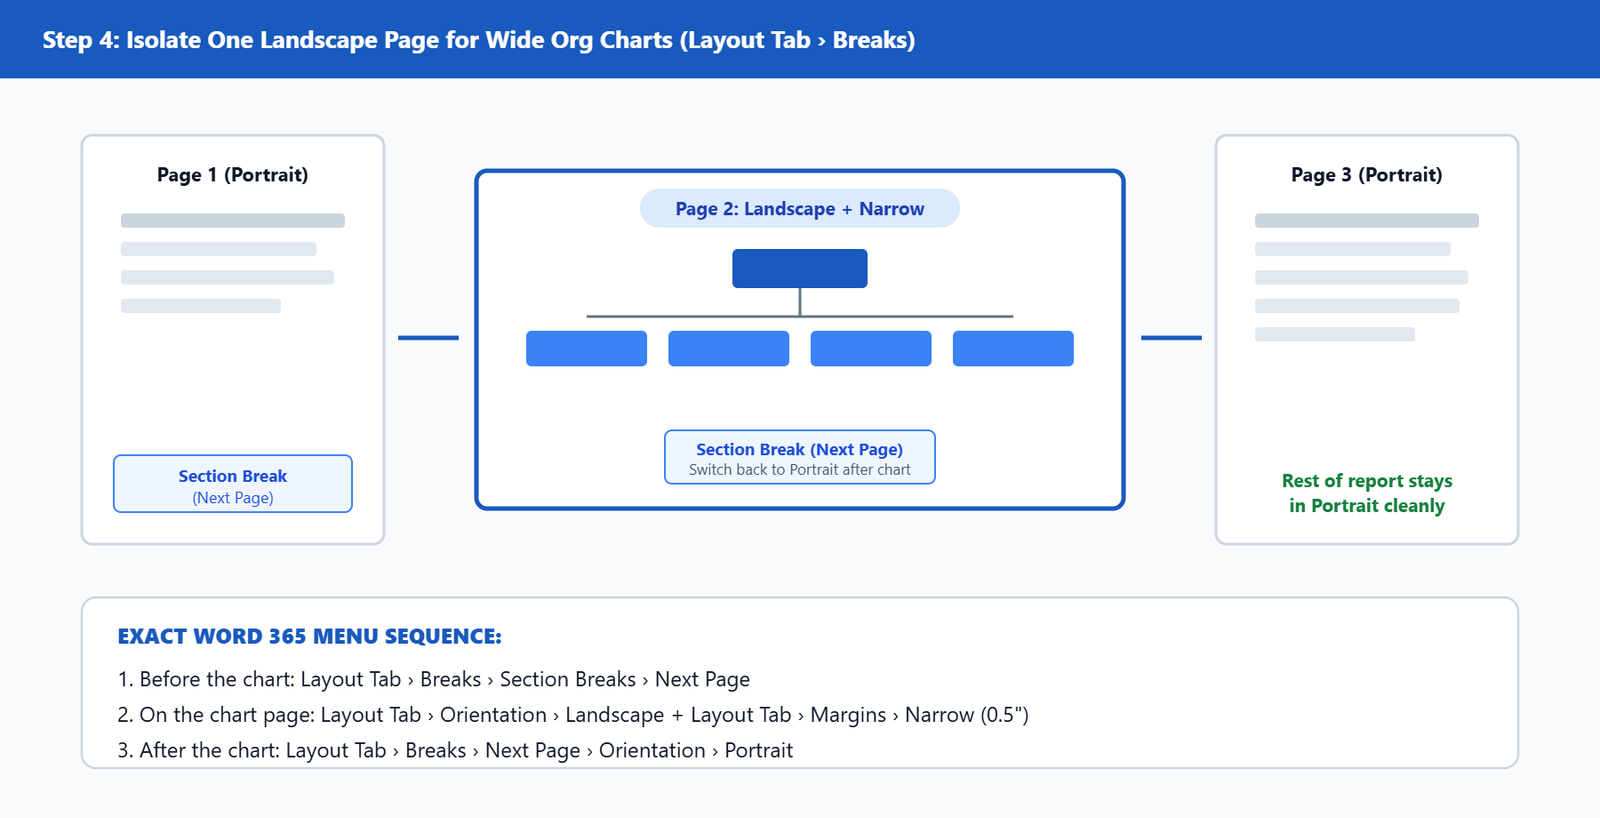
If your page numbers reset or headers twist unexpectedly after inserting section breaks, follow our dedicated guide on mixing Portrait and Landscape pages cleanly in Word.
Step 6: Polish Colors, Fonts, and Vector Export Quality
Once you make an org chart in Word and lock the reporting tree, avoid manually re-coloring boxes one by one—when someone moves teams, manual colors stay stuck on the wrong tier. Instead, style by tier:
- Theme Palette by Tier: Select the chart and click SmartArt Design > Change Colors. Pick one of the Accent gradient rows so your CEO sits in dark navy, VPs in medium steel blue, and managers in crisp light slate automatically.
- Lock Brand Typography: Press
Ctrl + Ainside a selected SmartArt shape to highlight all node text or use Home > Font (stick to clean sans-serif fonts like Segoe UI, Calibri, or Aptos so names stay legible at small sizes). - Don’t Take Low-Res Screenshots: If you need to share the chart in an executive deck or email, go to File > Save As > PDF rather than screenshotting Word. Word exports SmartArt shapes and text as crisp, infinite-zoom vectors. For more starter corporate layouts, browse our free Microsoft Word templates hub, or consult Microsoft’s official SmartArt reference for legacy Office 2016 builds.
(Running into locked or grayed-out SmartArt Design tabs when editing a shared company document? Check our diagnostic guide on fixing common Microsoft Word ribbon and editing problems).
Press Shift + Enter after typing the person’s name instead of pressing plain Enter. Shift + Enter creates a soft line break inside the exact same box so you can put the employee’s name on line one and their job title on line two without spawning a new employee card.
By design, SmartArt locks shape coordinates to keep connectors mathematically aligned. To reorder peers left-to-right or move someone to a different manager, use the Move Up / Move Down buttons on the SmartArt Design tab or cut-and-paste their bullet inside the Text Pane. If you must position every node manually, convert the chart to loose shapes via SmartArt Design > Convert > Convert to Shapes.
Word’s built-in SmartArt cannot dynamically bind to an Excel table, though you can copy a tab-indented column hierarchy and paste it straight into the SmartArt Text Pane to generate boxes instantaneously. For live Excel-synced org charts (50+ staff), use the free Microsoft Visio Data Visualizer add-in inside Excel and paste the synced diagram into Word.
Combine two tricks: first, click the manager box and switch subordinates via SmartArt Design > Layout > Both or Left Hanging so direct reports stack vertically instead of sprawling sideways. Second, use Next Page Section Breaks to flip only the chart page to Landscape with Narrow margins.